
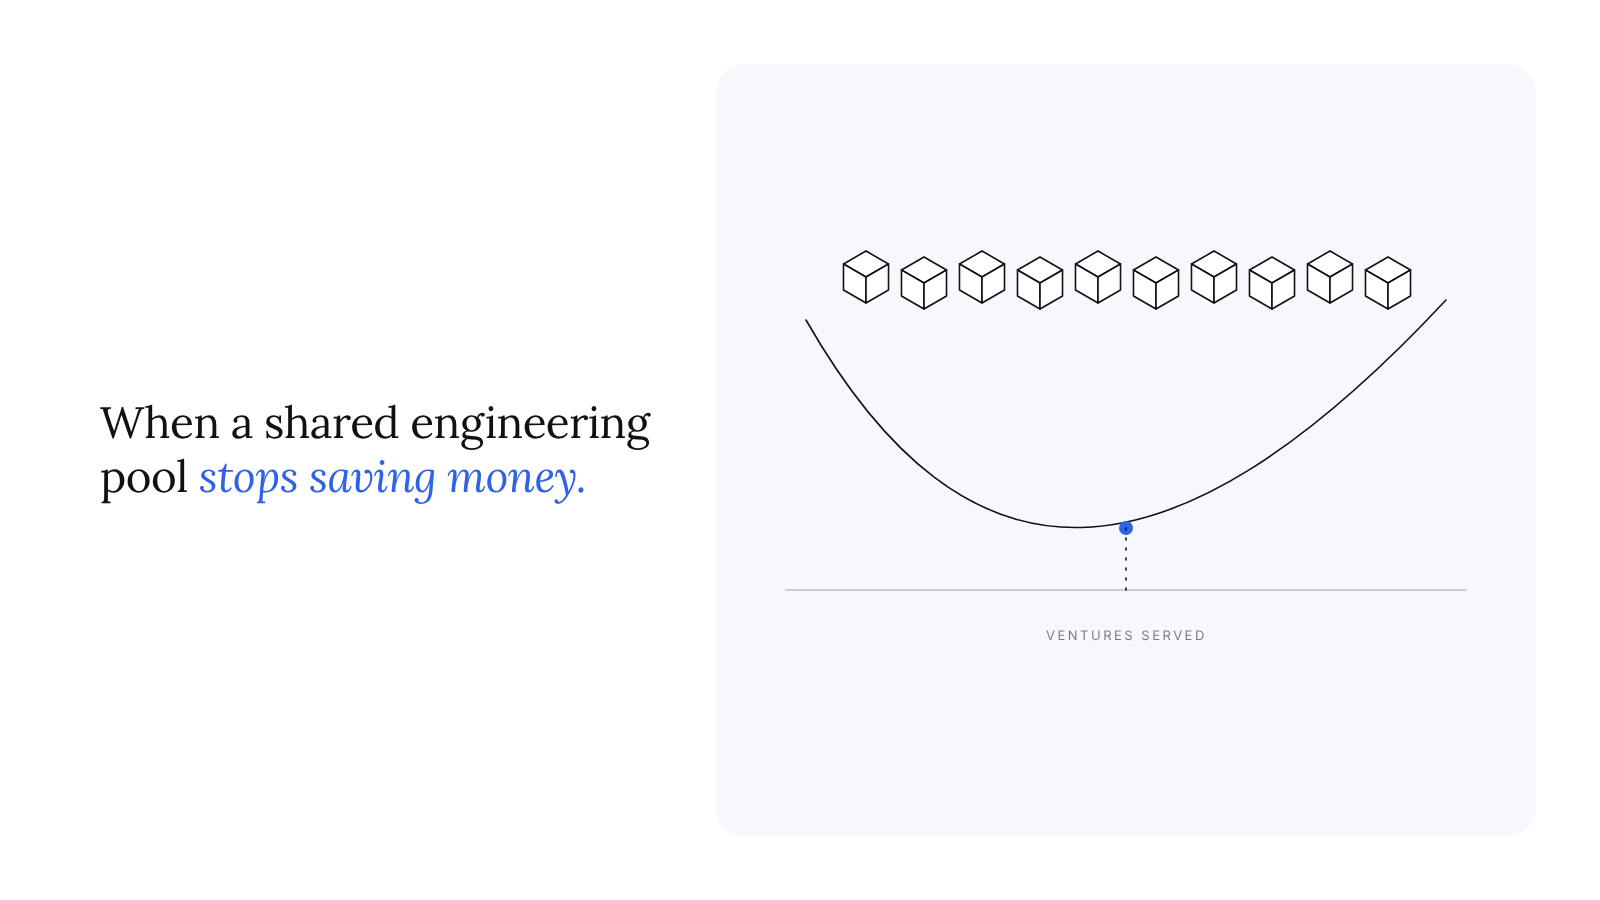
The case for venture studio shared services rests on a single economic claim: that a team of senior engineers, product people and operators shared across several young companies costs less per company than each company hiring its own. The claim is true for a while. A pool of twelve engineers serving one venture is absurdly expensive; the same pool serving four is a bargain. The error is to assume the line keeps going down. Somewhere between the fourth venture and the twelfth, the costs of sharing, which are coordination, context-switching and queuing, grow faster than the savings from spreading fixed cost, and the pool becomes more expensive per unit of delivered work than a dedicated team would have been.
This article builds an illustrative model of that curve with stated assumptions, shows where the crossover sits under those assumptions, and then examines what moves it. The evidence base is older than the venture studio industry: Brooks's observation about communication overhead from 1975, the experimental literature on task switching, and queueing theory. None of it was written about studios, but all of it applies to a fixed team serving a growing number of demanding clients. The practice example is PanScience Innovations' six-function model and its eight AI-infrastructure ventures, all company-reported figures used to show how a real studio's portfolio shape interacts with the curve.
What venture studio shared services actually buy
A studio's shared engineering pool does three things a venture cannot do for itself in its first year: it provides senior people a seed-stage company could not afford full time, it provides them immediately, and it provides them with the option to withdraw, so that an idea that fails in month four has not left a stranded team. The cost is that the pool's people are not dedicated: their time is rationed across ventures, and rationing has a price.
If the pool costs C per year and serves n ventures, cost per venture is C divided by n, which falls as n rises. That arithmetic is correct and it is the reason studios exist. It is also incomplete, because it treats the pool's output as fixed. The output falls as n rises, for three reasons that have each been documented separately.
The first is communication overhead. Fred Brooks's 1975 formulation, "Adding manpower to a late software project makes it later", rests on the observation that communication channels grow combinatorially as people are added and that team members spend more of their time keeping in sync (Brooks, The Mythical Man-Month, as summarised on Wikipedia). A shared pool suffers the same effect from the other direction: it is not the engineers who multiply but the contexts they must stay in sync with. Each additional venture adds a codebase, a roadmap, a set of stakeholders and a set of standing meetings.
The second is context switching. Gerald Weinberg's Quality Software Management, as cited by the Software Engineering Institute, estimates that a person on two simultaneous projects yields about 40 per cent effort per project, with roughly 20 per cent lost to switching, and that at five projects effort per project falls below 10 per cent with 80 per cent lost to switching (SEI Blog, Todd Waits, March 2015). The experimental literature is more cautious about the size but confirms the direction. Rogers and Monsell found that "even when people had to switch completely predictably between two tasks every two or four trials, they were still slower on task-switch than on task-repeat trials", and Rubinstein, Evans and Meyer found that "as tasks got more complex, participants lost more time" (American Psychological Association, "Multitasking: switching costs"). A controlled study of interrupted office work found that people compensated by working faster but reported significantly higher stress (6.92 to 9.46 on a 20-point scale), frustration and effort (Mark, Gudith and Klocke, CHI 2008). Faster, more stressed work is not a free lunch; it is a loan against quality and retention.
The third is queuing. When a shared resource is heavily utilised, the time a request waits for service grows non-linearly. In the simplest single-server queue, the average number of items waiting is ρ/(1 − ρ), where ρ is utilisation, and the model is stable only when arrivals are slower than service, otherwise "the queue will grow indefinitely long" (M/M/1 queue, Wikipedia). Kingman's 1961 approximation generalises this and is "known to be generally very accurate, especially for a system operating close to saturation" (Kingman's formula, Wikipedia). A studio that drives its pool to 90 per cent utilisation in the name of efficiency is choosing long waits for every venture, and a venture waiting three weeks for an engineer is burning its own runway while the studio congratulates itself on cost control.
An illustrative model with stated assumptions
The model below is original to this article and deliberately simple. Its purpose is to show the shape of the curve and the location of the crossover under one set of assumptions, not to predict any studio's actual costs. All figures are illustrative.
Assume a shared pool of twelve engineers at a fully loaded cost of ₹40 lakh each per year (senior ML, data and platform engineers in an Indian metro, inclusive of overheads), giving a pool cost of ₹4.8 crore. Assume each venture in its build year needs three engineer-years of work. Assume context-switching loss follows a Weinberg-style rule: each engineer loses 20 per cent of productive time for every concurrent venture beyond the first, capped at 80 per cent. Assume coordination overhead, the standing meetings, integration work and stakeholder management that come with each additional venture, follows Brooks's combinatorial logic and consumes 0.04 engineer-years per pair of ventures, which is roughly two hours a week per pair. The number of concurrent ventures per engineer is the total demand divided by pool size, with a floor of one.
For comparison, assume a dedicated team: three engineers per venture at ₹30 lakh each (less senior than the pool, which is the usual trade-off) at 60 per cent utilisation, since a dedicated team cannot be perfectly loaded. That gives ₹90 lakh for 1.8 delivered engineer-years, or ₹50 lakh per delivered engineer-year. The right comparison is cost per delivered engineer-year, not cost per venture, because the pool's output per venture is what shrinks.
| Ventures served | Concurrent ventures per engineer | Switching loss | Coordination (engineer- years) | Delivered engineer- years | Pool cost per venture (₹ lakh) | Pool cost per delivered engineer- year (₹ lakh) | Delivered per venture (engineer- years, of 3 needed) |
| 1 | 1.00 | 0% | 0.00 | 3.00 | 480 | 160 | 3.00 |
| 2 | 1.00 | 0% | 0.04 | 6.00 | 240 | 80 | 3.00 |
| 3 | 1.00 | 0% | 0.12 | 9.00 | 160 | 53 | 3.00 |
| 4 | 1.00 | 0% | 0.24 | 11.76 | 120 | 41 | 2.94 |
| 5 | 1.25 | 5% | 0.40 | 11.00 | 96 | 44 | 2.20 |
| 6 | 1.50 | 10% | 0.60 | 10.20 | 80 | 47 | 1.70 |
| 7 | 1.75 | 15% | 0.84 | 9.36 | 69 | 51 | 1.34 |
| 8 | 2.00 | 20% | 1.12 | 8.48 | 60 | 57 | 1.06 |
| 9 | 2.25 | 25% | 1.44 | 7.56 | 53 | 64 | 0.84 |
| 10 | 2.50 | 30% | 1.80 | 6.60 | 48 | 73 | 0.66 |
| 12 | 3.00 | 40% | 2.64 | 4.56 | 40 | 105 | 0.38 |
The sixth column is the arithmetic every studio deck shows: cost per venture falling smoothly from ₹480 lakh to ₹40 lakh. The seventh column is the one that matters. Cost per delivered engineer-year falls steeply to a minimum of about ₹41 lakh at four ventures, stays below the ₹50 lakh dedicated benchmark through seven ventures, crosses it at eight, and is more than double it by twelve. The final column explains why: at twelve ventures each one is receiving 0.38 engineer-years of the three it needs, so the studio is simultaneously cheap per venture and failing every venture.
This is the Shared-Service Cost Curve. It is U-shaped in cost per delivered unit of work, with a floor where the pool is fully loaded but not yet fragmented, and a rising arm driven by switching and coordination. The crossover against a dedicated team, under these assumptions, sits between seven and eight ventures for a twelve-person pool, or roughly 0.6 ventures per pool engineer. The exact numbers are artefacts of the assumptions; the shape is not.
What moves the crossover
Three levers shift the curve, and they correspond to three decisions a studio makes about how it is organised.
The first is vertical focus. The switching cost in the experimental literature depends on how different the tasks are: Rubinstein and colleagues found losses grew with complexity and unfamiliarity (APA). A pool whose engineers move between a judicial-workflow product and a protein-design product pays the full switching penalty; a pool moving between two products that both sit on the same data pipeline, serve the same buyer and use the same model stack pays a fraction of it. Halving the switching coefficient in the model from 20 per cent to 10 per cent per additional concurrent venture moves the crossover from eight ventures to nine and flattens the rising arm substantially: at twelve ventures cost per delivered engineer-year is ₹69 lakh rather than ₹105 lakh. Vertical focus is the cheapest lever because it costs nothing in headcount.
The second is common platform components. If the studio has built reusable infrastructure, an LLM gateway, an annotation pipeline, a deployment template, an auth and billing layer, then each venture needs fewer engineer-years from the pool because part of its product already exists. Reducing need per venture from three engineer-years to two in the model moves the floor of the curve from four ventures to six and the crossover to nine. Combining both levers, vertical focus and platform reuse, keeps cost per delivered engineer-year below ₹60 lakh all the way to twelve ventures. This is the economic logic behind a studio that is also, in effect, a platform company: the platform is not a side project, it is what keeps the rising arm of the curve from rising.
The third is stage mix. The model assumes every venture is in its build year and needs three engineer-years. A real portfolio has ventures in validation (needing a fraction of an engineer for a few weeks), in build (needing the full allocation), and post-spin-out (needing nothing from the pool, or a paid retainer). The number that drives the curve is not the number of ventures on the website but the number drawing on the pool concurrently. A studio with twenty-four ventures of which four are in active build is at the floor of the curve; the same studio with twelve in active build is well past the crossover. Managing stage mix, which in practice means staging starts so that build phases do not pile up, is the operational lever most directly in the studio's control.
A fourth factor the model does not capture is which venture waits. Queueing theory says waits grow non-linearly near saturation; in practice the venture that waits is the one with the least senior sponsor, which is often the one whose problem matters most. A pool at the top of the curve does not just deliver less; it delivers to the wrong ventures.
How a real studio's portfolio shape sits on the curve
PanScience Innovations publishes a model with six shared in-house functions: product; technology, described as a shared pool of senior ML, data and platform engineers; go-to-market; operations and hiring; finance and capital; and legal (company-reported, panscience.xyz, read October 2026). It reports a portfolio of 24-plus co-founded ventures across nine verticals, of which 13 are described as active and scaling, 7 growth stage, 4 early or seed, and 3 in stealth. Eight of the 24 are in AI infrastructure, and the named ventures include an LLM gateway (Proteus), an AI control plane (Own360), on-prem AI and RAG products (Eigen, Insituate AI), and a data-centric AI and annotation business (Indika AI, FlexiBench).
Read against the curve, three features of that shape are instructive, with the caveat that the company does not publish how many engineers are in its pool or how many ventures draw on it concurrently, so no cost figure can be computed. First, the stage distribution is the lever the model says matters most: if the 13 active-and-scaling ventures have largely left the pool and the 4 early-stage and 3 stealth ventures are the ones drawing on it, the concurrent load is nearer seven than twenty-four. Second, the concentration of eight ventures in AI infrastructure, several of them explicitly infrastructure for other AI products (a gateway, a control plane, an annotation workforce), is the platform lever: a studio whose portfolio includes the components its other ventures need has partly built the "need per venture" reduction into its portfolio rather than its cost centre. Third, nine verticals is a wide spread, which on the switching-cost evidence works against the curve; whether the common AI-infrastructure layer offsets the vertical breadth is exactly the empirical question a studio should be measuring and is not something an outside observer can settle.
PanScience's published model also places the spin-out at month 18-plus, after which the venture "keeps ecosystem access" but graduates to its own leadership. In the terms of this article, that is the moment a venture leaves the pool's concurrent load. The studio's economics therefore depend on that marker being enforced: a venture that stays on the pool at month 30 is occupying capacity the model says should have been freed for a new one.
Three conditions under which sharing stops paying
The curve yields three conditions, each observable, under which a shared pool has stopped saving money even if cost per venture is still falling. They are stated as the original contribution of this article alongside the curve itself.
The first condition is concurrent load above the crossover. When the number of ventures in active build, divided by the pool's headcount, exceeds the ratio at which cost per delivered engineer-year crosses the dedicated benchmark (about 0.6 under the base assumptions, higher with vertical focus and platform reuse), the pool is delivering work more expensively than hiring would. The tell is not a cost report; it is that delivered engineer-years per venture have fallen well below what the venture needs, which shows up as roadmaps slipping across every venture at once.
The second condition is switching dominated by dissimilarity. When the ventures drawing on the pool share neither a buyer, a data pipeline nor a model stack, the switching coefficient is at the high end of the Weinberg range and the rising arm of the curve is steep. The tell is engineers who cannot say what they are working on this week without checking, and ventures whose integration bugs cluster around handoffs between people rather than within one person's work.
The third condition is saturation queuing. When pool utilisation is pushed above roughly 80 per cent in the name of efficiency, waiting times for every venture grow faster than throughput improves, and the ventures that wait are not chosen on merit. The tell is a backlog that never clears and a quiet reordering of priorities by whoever shouts loudest. Queueing theory predicts this precisely; studio operators tend to experience it as a morale problem rather than a structural one.
When any of the three holds, the remedy is not to abandon sharing but to move along the levers: narrow the vertical spread of what the pool serves, invest in platform components that reduce need per venture, stagger build phases so concurrent load falls, or, failing those, convert the shared allocation for the heaviest venture into a dedicated team and accept the higher headline cost in exchange for actually delivering.
Conclusion
The shared engineering pool is the mechanism by which a venture studio turns fixed cost into optionality, and the arithmetic that justifies it, pool cost divided by ventures served, is correct as far as it goes. It stops going at the point where the pool's output per venture falls faster than its cost per venture, and that point arrives earlier than most studio plans assume: in the illustrative model, between seven and eight ventures for a twelve-person pool, before the pool has reached the scale the cost-per-venture line was promising.
The three levers that push the crossover out, vertical focus, platform reuse and stage-mix discipline, are all things a studio decides rather than things that happen to it. A studio that treats its shared pool as a cost centre to be loaded as heavily as possible will find the curve's rising arm; a studio that treats it as a constrained resource to be protected from fragmentation will stay near the floor. The difference is not visible in cost per venture, which is why cost per venture is the wrong metric, and why cost per delivered engineer-year, however roughly estimated, is the one worth tracking.
Methodology and sources
The Shared-Service Cost Curve and the three conditions are original to this article. The model is a deterministic spreadsheet-style calculation with the assumptions stated in full in the text: twelve pool engineers at ₹40 lakh fully loaded; three engineer-years needed per venture in build; 20 per cent switching loss per concurrent venture beyond the first per engineer, capped at 80 per cent; coordination overhead of 0.04 engineer-years per venture pair; concurrent ventures per engineer equal to total demand divided by pool size with a floor of one; dedicated benchmark of three engineers at ₹30 lakh at 60 per cent utilisation. Sensitivities reported in the text halve the switching coefficient and reduce need per venture to two. Limitations: the switching and coordination coefficients are borrowed from software-project evidence, not measured in studios; the model ignores learning effects, seniority differences within the pool, and the option value of being able to withdraw a team; the dedicated benchmark is a single point estimate; and no studio's actual costs were used. PanScience figures are company-reported and no pool size or concurrent load is published, so the discussion of its portfolio is qualitative.
Sources: Wikipedia, "Brooks's law", summarising Brooks, The Mythical Man-Month (1975) (https://en.wikipedia.org/wiki/Brooks%27s_law); Software Engineering Institute blog, Todd Waits, "Addressing the Detrimental Effects of Context Switching with DevOps", 5 March 2015, citing Weinberg, Quality Software Management (https://www.sei.cmu.edu/blog/addressing-the- detrimental-effects-of-context-switching-with-devops/); American Psychological Association, "Multitasking: switching costs", summarising Rogers and Monsell, Rubinstein, Evans and Meyer (2001), and others (https://www.apa.org/topics/research/multitasking); Mark, Gudith and Klocke, "The Cost of Interrupted Work: More Speed and Stress", CHI 2008 (https://www.interruptions.net/literature/Mark-CHI08.pdf); Wikipedia, "M/M/1 queue" (https://en.wikipedia.org/wiki/M/M/1_queue); Wikipedia, "Kingman's formula" (https://en.wikipedia.org/wiki/Kingman%27s_formula); PanScience Innovations, company-reported model and portfolio figures (https://panscience.xyz).