
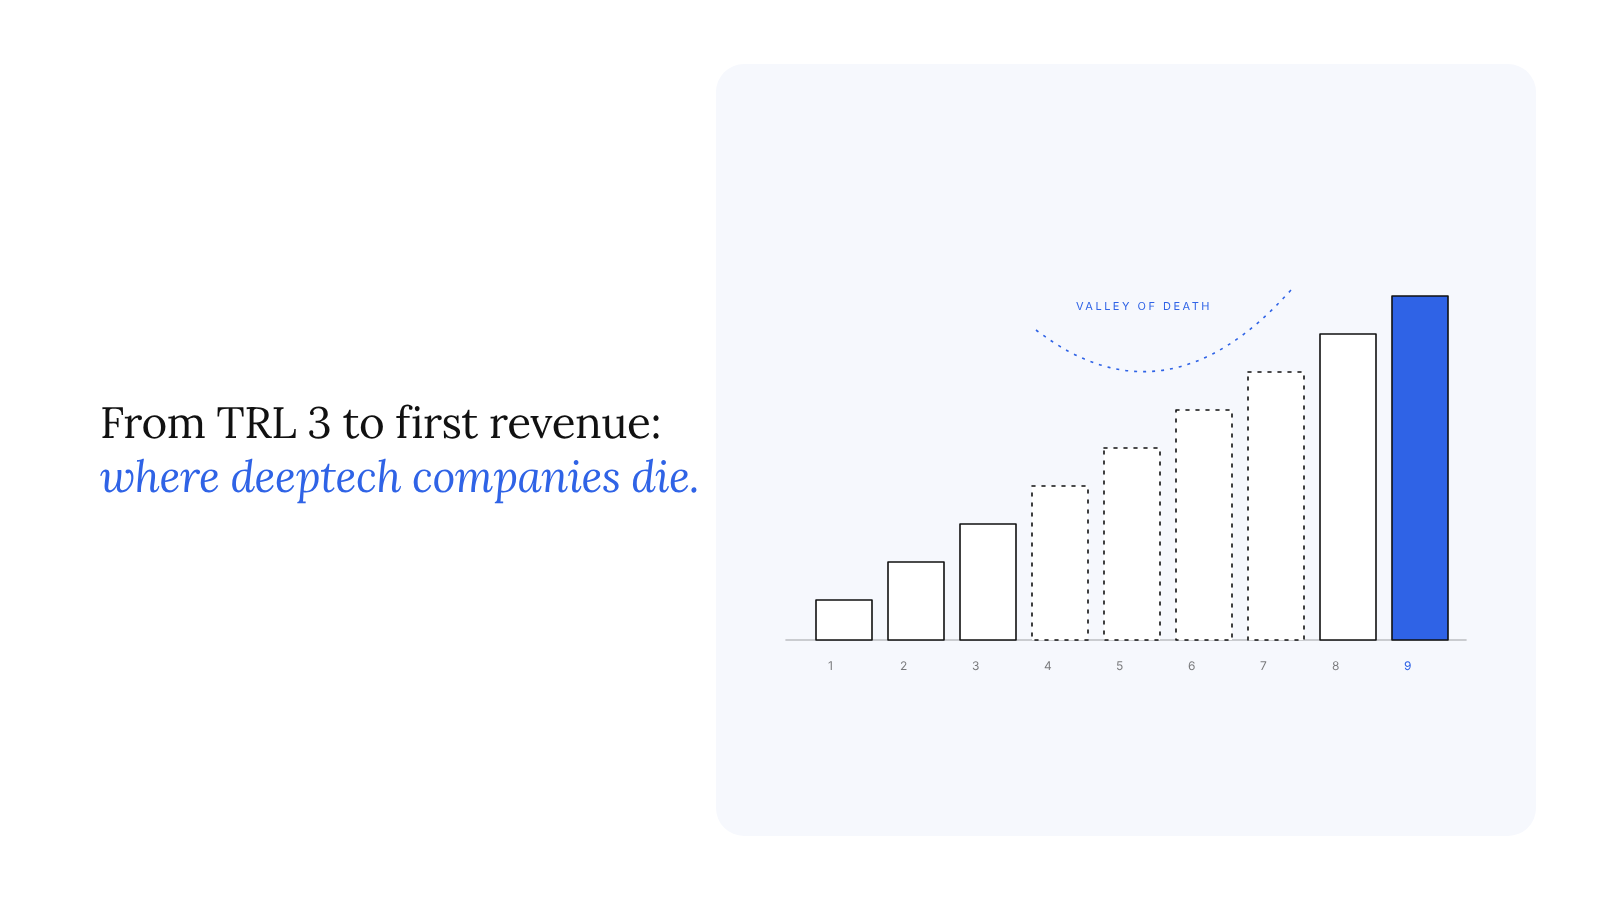
Most deeptech companies do not die in the laboratory. They die later, after the proof of concept has worked, the first paper has been published and the founding team has raised enough money to believe it has a company. They die in the long middle stretch where a technology is too mature for research grants, too immature for customers and too uncertain for most investors. Engineers and policymakers have a name for that stretch, the valley of death, and they have a scale on which to locate it: the nine technology readiness levels first introduced by NASA and later adopted by the European Commission for its research programmes.
Technology readiness levels are a useful instrument, but they measure only one thing: technical maturity. A venture can climb from TRL 3 to TRL 7 and still have no buyer, no price, no supply chain and no certificate. The reverse failure is also common: a venture signs letters of intent at TRL 3 and then discovers, three years and several million dollars later, that the product those letters described cannot be built at the cost they assumed.
This article locates the valley of death on the TRL scale, explains why companies fail there, and proposes a map that pairs each technology readiness level with the commercial milestone that should accompany it. The aim is practical: to give founders, studio operators and investors a common language for asking not only "how mature is the technology?" but "is the business as mature as the technology?"
What technology readiness levels measure, and what they do not
The European Commission's Horizon 2020 work programme gives the most widely used short definitions. TRL 1 is "basic principles observed"; TRL 2, "technology concept formulated"; TRL 3, "experimental proof of concept"; TRL 4, "technology validated in lab". TRL 5 and 6 are "technology validated in relevant environment" and "technology demonstrated in relevant environment", with the Commission adding that for key enabling technologies the relevant environment is an industrially relevant one. TRL 7 is "system prototype demonstration in operational environment", TRL 8 "system complete and qualified", and TRL 9 "actual system proven in operational environment", which for key enabling technologies means competitive manufacturing.
NASA's own descriptions, written for spacecraft, make the same progression concrete. At TRL 3 analytical and laboratory studies test viability, often producing a proof-of-concept model. At TRL 5 the technology is a "breadboard" that requires more rigorous testing in environments as realistic as possible. At TRL 6 a completely working prototype exists. At TRL 8 the technology is "flight qualified", and at TRL 9 it is "flight proven" through a successful mission.
Three features of the scale matter for commercialisation. First, it is about the technology, not the company: nothing in the nine definitions mentions customers, price, cost of goods or regulation beyond qualification. Second, the steps are not equal in time or cost. Moving from TRL 2 to TRL 3 may take months in a well-equipped laboratory; moving from TRL 6 to TRL 8 may take years and require purpose-built test facilities. Third, the scale is written for systems. A venture whose product depends on several technologies at different levels is only as ready as its least mature component, which is one reason why system integration so often takes longer than founders expect.
Critics have also argued that readiness scales encourage a linear view of innovation. The UK House of Commons Science and Technology Committee recorded this criticism in its 2013 report on commercialisation. The criticism is fair, but it does not make the scale useless. It means that the scale should be read alongside a commercial track, which is what the map later in this article attempts. The Australian Renewable Energy Agency took a similar view when it developed a Commercial Readiness Index to complement TRLs; as a 2017 Carbon Trust study of that index put it, "beyond technical development", technologies "also need to prove their commercial viability".
Where the valley of death sits on the technology readiness levels scale
The committee's 2013 report, "Bridging the valley of death: improving the commercialisation of research", gave a simple definition. The valley of death, it said, "describes the point where a business, often a technology based business, has a working prototype for a product or service that has not yet been developed enough to earn money through commercial sales." The company "needs to find sufficient money to develop the prototype until it can generate sufficient cash".
Rolls-Royce, in written evidence to the same inquiry, located that point on the TRL scale. "The valley of death can be expressed in TRL terms," the company wrote. "It normally reflects the difficulty of getting a new technology through TRLs 4 to 7. In this area the investment required is high, but the certainty of success remains low." Rolls-Royce also described a division of labour: universities, it argued, must be prepared to take a technology to TRL 3 or 4 before an industrial partner takes it on for large-scale testing.
That division explains the shape of the problem. Public research funding is designed for TRL 1 to 3, where the output is knowledge. Corporate procurement and most venture investment are designed for TRL 7 to 9, where the output is a product that can be bought or scaled. Between TRL 4 and TRL 7, a venture needs large sums to build and test prototypes in realistic conditions, while the probability of technical success is still low. Neither the research funder nor the commercial buyer is set up to pay for that stretch.
The Indian data point to the same gap, shifted slightly earlier. YourStory's coverage of the IVCA Bharat DeepTech Report 2026 reports that only about 15% of funds back ventures at TRL 1 to 3, and that investor participation drops sharply after seed. A separate PanScience Research piece on deeptech funding in India maps which capital exists at each stage and where it runs out.
Why deeptech companies die between TRL 4 and TRL 7
The committee's report, read alongside the Rolls-Royce evidence, identifies several mechanisms. Adding what studio operators observe in practice, five stand out.
The first is the missing test facility. Rolls-Royce told the committee that large-scale test facilities "are essential to take technology through the TRLs 4, 5 and 6", and the committee concluded that the UK small business sector "lacks access to large scale test and experimental production facilities". A venture that cannot test its prototype in a relevant environment cannot reach TRL 6, however good its science.
The second is the broken investment ladder. The committee warned that "if the investment ladder is not complete then companies may take development steps at inappropriate times". A venture that cannot raise money for a pilot plant may skip straight to a commercial design, or may sign a customer contract before it can deliver. Both moves look like progress and are often fatal.
The third is the qualification wall. Buyers in industrial, medical, defence and infrastructure markets usually buy at TRL 8 or 9, after qualification. A venture at TRL 6 has a working prototype but nothing the buyer's procurement process recognises. The gap is not technical ignorance on the buyer's side; it is that the buyer's own risk rules prevent it from buying unqualified equipment.
The fourth is the team transition. The people who take a technology to TRL 4 are researchers. The people who take it to TRL 8 are engineers, quality managers and operations specialists. Many ventures try to cross the valley with the founding research team alone, and discover too late that the skills needed to design for manufacture, run a qualification programme or manage a supply chain are different.
The fifth is commercial drift. A venture that spends years climbing from TRL 4 to TRL 7 without testing its commercial assumptions may find that the market has moved, a competitor has arrived, or the cost of its product at scale is higher than buyers will pay. This is the failure that the TRL scale cannot detect on its own, because it measures only the technology.
The first four mechanisms are mostly about money and infrastructure. The fifth is about discipline, and it is the one a venture can control most directly. The map below is designed to address it.
A TRL-to-market-readiness map
The table pairs each technology readiness level with the commercial milestone that should accompany it, the evidence that milestone produces, the capital most likely to pay for that stage, and the warning sign that the commercial track has fallen behind the technical one. The pairings are PanScience Research's analytical proposal, not a published standard. They are illustrative: the right milestone for a medical device will differ from the right milestone for an industrial sensor or a software-defined quantum product, and teams should adapt them.
The map rests on three assumptions. The first is that commercial evidence can be gathered cheaply at low TRLs: interviews, cost baselines and specifications cost far less than prototypes, so there is little excuse for skipping them. The second is that the commercial milestone at each level should be achievable within roughly the same time as the technical one, so that neither track waits for the other. The third is that the buyer's procurement rules, not the venture's enthusiasm, decide when a sale is possible, which is why the map ties first orders to qualification at TRL 8 rather than to the first successful demonstration.
How to use the map
Three rules follow from the table.
Keep the tracks within one level of each other. A venture at TRL 6 with only a TRL 3 commercial milestone, a target specification but no design partner, is technically ahead and commercially behind. It will probably reach the end of its pilot with no buyer ready to purchase. A venture at TRL 3 with a TRL 7 commercial milestone, a priced pilot agreement for a technology that has only worked once in the laboratory, has promised more than it can deliver. Both imbalances are dangerous; the first is more common in scientist-led ventures, the second in ventures led by commercial founders.
Use the warning signs as gates. Each warning sign in the right-hand column is a reason to pause before spending the money required for the next level. The most expensive moves on the scale are from TRL 5 to 7, where the valley of death sits, and those are the moves that most need commercial evidence first. A studio or investor that funds a venture across the valley without a signed design partner and a pilot with purchase criteria is funding science, which may be worthwhile, but should not be confused with funding a company.
Match the money to the milestone. The capital column is a reminder that each stage tends to have a natural funder, and that using the wrong money for a stage creates problems. Equity raised at seed to pay for TRL 2 research is expensive and dilutes founders before the technology has proved anything. Grant money used to run a commercial pilot may come with restrictions that stop the venture from charging the customer. A separate article in this cluster on deeptech funding in India examines the capital available at each level in more detail, and a later piece on the deeptech startup timeline turns this map into a milestone plan with go and no-go criteria.
What changes in practice
For a studio, the map changes the order of work. Commercial staff join earlier, at TRL 3 or 4 rather than at TRL 7, and their first job is not selling but specifying: what would a buyer need, at what price, with what certification? Engineering and quality staff join at TRL 5 or 6, before the pilot, because the pilot is where design-for-manufacture decisions begin to bind. Grant management and corporate partnership work run throughout.
For corporates acting as design partners, the map clarifies what to offer and what to ask. At TRL 5 the most valuable contribution is access to realistic test conditions and data, not money. At TRL 6 and 7 a corporate should insist on success criteria that would trigger a purchase, and should be clear internally about which budget will pay if the pilot succeeds. Pilots without that clarity are the corporate version of commercial drift.
For public funders, the analysis supports the committee's own conclusion that test facilities and patient capital for TRL 4 to 7 deserve specific attention. Funding schemes that require commercial milestones alongside technical ones, and that allow ventures to charge pilot customers, would align public money with the evidence private investors need.
Conclusion
Technology readiness levels describe how mature a technology is. They do not describe whether a company exists around it. The valley of death sits between TRL 4 and TRL 7, where Rolls-Royce told the House of Commons committee that "the investment required is high, but the certainty of success remains low", and where Indian data show investor participation thinning after seed. Ventures that survive it tend to have done two things: found the money and facilities to test in realistic conditions, and kept the commercial track within one level of the technical one. The map above is one way to make the second discipline explicit and to give founders, studios, corporates and funders a shared view of what each stage should prove.
Methodology and sources
The TRL-to-market-readiness map and the three rules for using it are original to PanScience Research. They are an analytical proposal based on the sources below, not an observed dataset, and the pairings are illustrative. TRL definitions are quoted from the European Commission, Horizon 2020 Work Programme 2014-2015, General Annexes, Annex G (ec.europa.eu/research/participants/data/ref/h2020/wp/2014_2015/annexes/h2020-wp1415-annex-g-trl_en.pdf) and from NASA's page on technology readiness levels (nasa.gov/directorates/somd/space-communications-navigation-program/technology-readiness-levels). The definition of the valley of death and the committee's findings on test facilities and the investment ladder come from the House of Commons Science and Technology Committee, "Bridging the valley of death: improving the commercialisation of research", Eighth Report of Session 2012-13, March 2013 (publications.parliament.uk/pa/cm201213/cmselect/cmsctech/348/34805.htm). The location of the valley of death at TRL 4 to 7 is from Rolls-Royce's written evidence to that inquiry (publications.parliament.uk/pa/cm201213/cmselect/cmsctech/348/348we21.htm). The Commercial Readiness Index reference is from the Carbon Trust study page (carbontrust.com/our-work-and-impact/guides-reports-and-tools/assessing-the-commercial-maturity-of-renewable- energy-technologies-moving-beyond-technology-readiness). Indian funding figures are from YourStory's August 2026 coverage of the IVCA Bharat DeepTech Report 2026 (yourstory.com).