
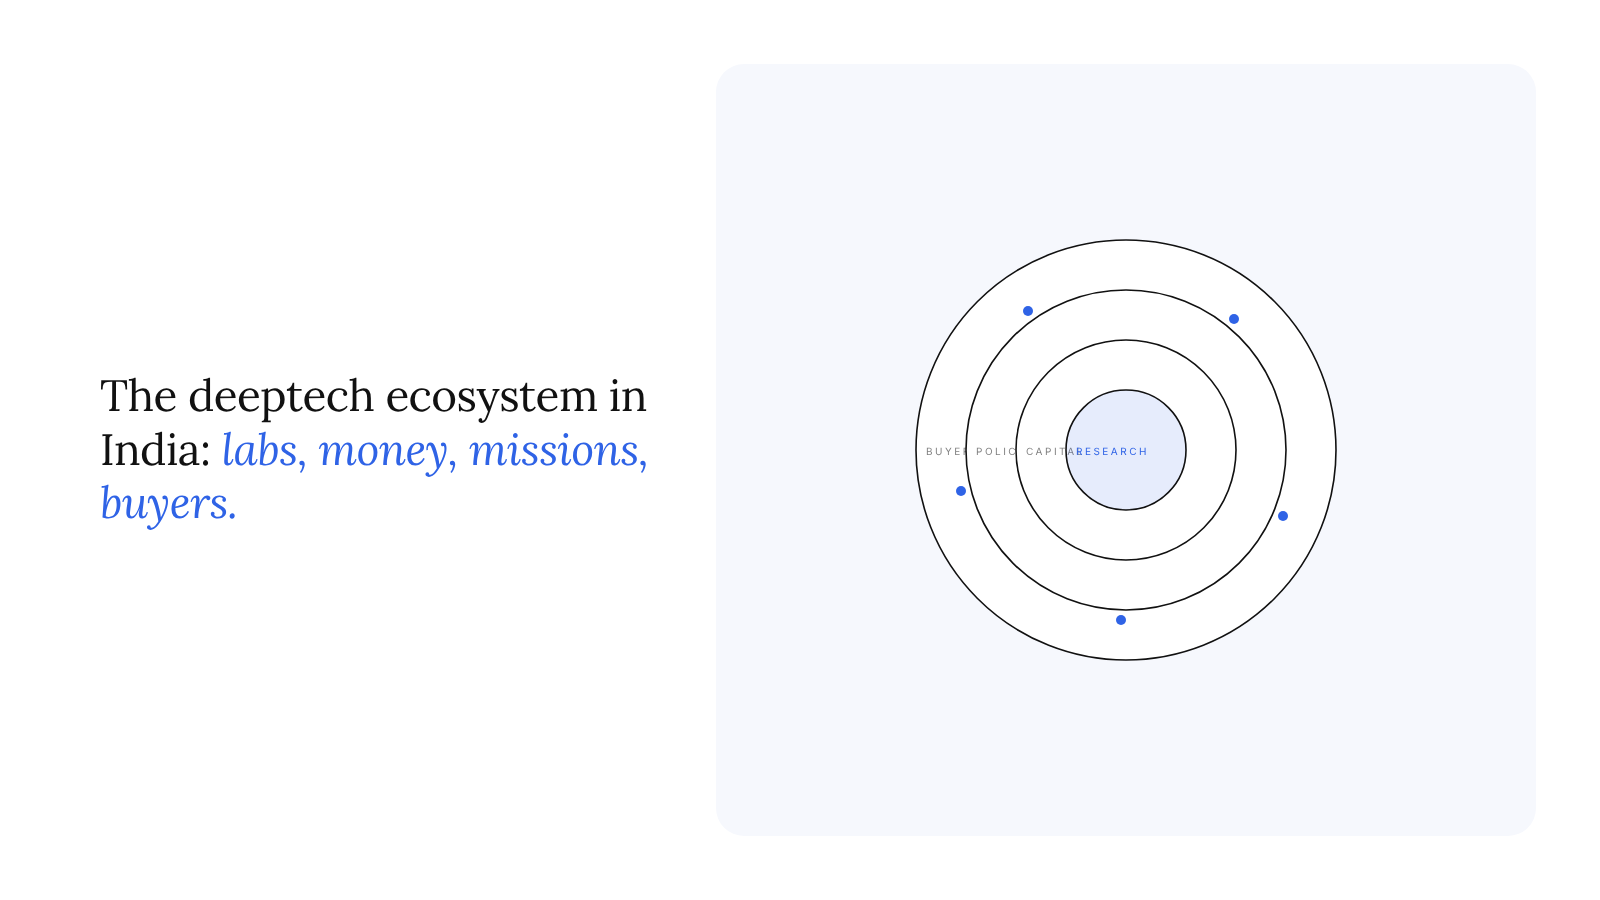
Describing the deeptech ecosystem in India has become a matter of choosing which list to read. There is the list of national missions, now covering artificial intelligence, quantum technologies, semiconductors, space and more. There is the list of funds and schemes, from the ₹1 lakh crore Research Development and Innovation scheme to the Startup India Fund of Funds. There is the list of startups, more than 4,200 of them classified as deeptech by Nasscom and Zinnov. And there is the list of research outputs, with Indian patent filings growing at double- digit rates for six consecutive years.
Each list is impressive. None of them, on its own, describes an ecosystem. An ecosystem is defined less by its parts than by the connections between them: whether laboratory results reach companies, whether capital reaches the stages where companies need it, whether missions create buyers as well as suppliers, and whether buyers send problems back to the laboratories. In India, as in most countries, the parts have grown faster than the connections.
This article maps India's deeptech ecosystem as four layers, research, capital, policy and demand, sets out what each layer holds in 2026 on the official and published figures, and identifies the gaps between them. The aim is to give founders, corporates, investors and policymakers a shared picture of where effort will have most effect.
The four layers of the deeptech ecosystem in India
The research layer produces knowledge, people and intellectual property. Its institutions are universities, national laboratories, government research organisations and corporate research and development units. Its currency is grants and publications.
The capital layer turns knowledge into companies. It includes public research funders acting as investors, venture and private equity funds, funds of funds, corporate venture capital, strategic investors and lenders. Its currency is equity and debt.
The policy layer sets direction and changes the economics. It includes the national missions, regulators, recognition and incentive schemes, and public procurement rules. Its currency is mandates, subsidies and rules.
The demand layer buys what the others produce. It includes government departments and missions as buyers, public sector undertakings, private corporates, and, for some technologies, consumers and international customers. Its currency is purchase orders.
Deeptech companies have to pass through all four. A quantum sensing venture, for instance, starts from research, needs capital to build a product, depends on policy to fund its early market, and survives only if a buyer with a budget appears. Weakness in any one layer, or in the connection between two of them, can stop the venture even if the other layers are strong.
The research layer: rising output, low spending
India's research layer is producing more, on a small base. Department of Science and Technology statistics reported in Parliament put gross expenditure on research and development at ₹2,44,767.81 crore in 2023-24, or 0.84% of GDP. WIPO reported that Indian patent filings grew 19.1% in 2024, the sixth consecutive year of double-digit growth, and the Controller General of Patents' annual report for 2024-25 recorded 110,375 filings, 61.79% of them by domestic applicants. Nasscom and Zinnov report that startup patent filings have risen by about 68% since 2020-21.
The Anusandhan National Research Foundation, approved by the Cabinet in June 2023 with an estimated total cost of ₹50,000 crore over 2023 to 2028 and absorbing the earlier Science and Engineering Research Board, is the main attempt to raise the volume and change the direction of research funding, including by drawing in industry.
The pattern is one of growing output and growing domestic ownership of intellectual property, against a spending base that remains low as a share of the economy. For deeptech, the more important question is what share of that output is designed with a commercial path in mind, and the data do not answer it.
The capital layer: more money, concentrated
The capital layer has grown fastest. YourStory's coverage of the IVCA Bharat DeepTech Report 2026 records close to $11.4 billion of private equity and venture investment in Indian deeptech between 2015 and mid-2026, and $2.96 billion in 2025 alone, the strongest year on record. Nasscom and Zinnov count $2.3 billion of deeptech funding in 2025 on their own definitions, 91% of it in AI.
Public capital is being redesigned to complement private money. The Research Development and Innovation scheme, approved in July 2025, has a ₹1 lakh crore corpus held in a Special Purpose Fund within ANRF and allocated to second-level fund managers mainly as long-term concessional loans, with equity possible for startups and a Deep-Tech Fund of Funds envisaged. The Startup India Fund of Funds, according to the Prime Minister's Office in February 2026, committed to 145 alternative investment funds, with ₹25,500 crore leveraged for more than 1,370 startups, and a second ₹10,000 crore fund of funds has been approved. Sector-specific vehicles have appeared too: the Cabinet approved a ₹1,000 crore venture capital fund for the space sector under IN-SPACe in October 2024, intended to support about 40 startups with growth-stage tickets of ₹10 crore to ₹60 crore.
The capital layer's weakness is distribution rather than size. IVCA finds that only 15% of surveyed funds back technologies at TRL 1 to 3, that participation drops sharply after seed and that a Series B/C gap opens at growth stage. A companion PanScience Research piece maps the capital stack by readiness level in detail.
The policy layer: missions that build supply
The policy layer is where India's deeptech strategy is most visible. Four missions illustrate its shape.
The IndiaAI Mission, with an outlay of ₹10,371.92 crore, had by February 2026, according to a PIB backgrounder, made more than 38,000 GPUs available at about ₹65 an hour, listed 7,541 datasets and 273 models on its AIKosh platform, and selected 12 startups to build foundation models.
The National Quantum Mission, approved in April 2023 with ₹6,003.65 crore for 2023-24 to 2030-31, aims at intermediate-scale quantum computers with 50 to 1,000 physical qubits in eight years, satellite-based secure quantum communication over 2,000 km between ground stations in India, and inter-city quantum key distribution over 2,000 km. It is organised around four thematic hubs: quantum computing, quantum communication, quantum sensing and metrology, and quantum materials and devices.
The India Semiconductor Mission's first phase carried a ₹76,000 crore incentive framework. A PIB document of February 2026 records 10 approved projects across six states as of December 2025, with total investment of ₹1.60 lakh crore, and a Design Linked Incentive scheme that had supported 24 startups, which had raised nearly ₹430 crore of venture capital. The Union Budget for 2026-27 announced a second phase focused on equipment, materials, indigenous intellectual property and supply chains.
Space policy has opened a sector that was almost entirely public. An IN-SPACe director told a policy conference in July 2026, as reported by YourStory, that India now has more than 450 space startups, up from single digits six years earlier, and that IN-SPACe has issued about 113 authorisations. The Cabinet's 2024 note on the space venture fund put the Indian space economy at $8.4 billion, with a target of $44 billion by 2033.
The common feature is that the missions fund supply: compute, research hubs, fabrication units, design incentives, launch and authorisation. That is a sensible first step. Supply without demand, however, produces companies that can build but cannot sell. The DPIIT's new Deep Tech Startup recognition category, with a 20-year window and a ₹300 crore turnover ceiling, is a further supply-side measure; a separate article in this cluster sets out what it changes.
The demand layer: buyers arriving late
The demand layer is the thinnest and the least measured. The Government e-Marketplace, according to a PIB document of February 2025, had processed orders worth ₹4,52,594 crore in the financial year to date, and startups had fulfilled orders worth ₹35,950 crore. A dedicated category, Startup Runway 2.0, lets startups list innovative products and services for government buyers without requiring DPIIT recognition. These are meaningful numbers, but most GeM purchases are of standardised goods and services, and the platform is designed for products that already exist.
Private demand appears mainly at the end of the cycle. Nasscom and Zinnov count more than 140 technology M&A deals in 2025, about 36% of them by Indian corporates. Acquisition is a valuable exit, but it is a late form of demand: the corporate buys the company after the technology has been proven, rather than buying the product while it is being developed. Production-linked incentive schemes, which a Lok Sabha reply in July 2026 credited with ₹2.40 lakh crore of investment, are building manufacturing capacity whose operators could become deeptech buyers, but the link is not automatic.
The IVCA survey's call for public procurement mandates and a predictable demand pipeline is, in effect, a request to strengthen this layer. A later article in this cluster examines how deeptech ventures can sell to the Indian state.
An ecosystem layer map, with the gaps between layers
The table below is PanScience Research's layer map. For each layer it lists what it holds, what it should hand to the next layer, and the gap observed at that interface. The holdings are drawn from the sources in this article. The gap descriptions are analytical readings of those figures, not measured quantities.
Read as a cycle, the map shows that each layer's output is larger than the next layer's capacity to absorb it. Research produces more patents than capital will fund at early stages. Capital produces more seed-stage companies than growth capital will carry. Policy produces more supply-side capacity than buyers have committed to purchase. And demand, arriving late, sends weak signals back to research about what to build.
Three features of the map deserve emphasis. First, the interfaces matter more than the layers. Adding money to any single layer, without strengthening the connection to the next, tends to increase the pile-up at the interface. Second, the demand interface is the one that most affects the others. A credible purchase commitment from a mission or corporate makes it easier for a venture to raise patient capital, and gives researchers a specification to work towards. Third, the interfaces are where organisations that span layers add most value: technology transfer offices that understand investors, funds that understand procurement, corporates that run paid pilots, and venture builders that work with laboratories, funders and buyers at once. PanScience, for example, reports working with more than 10 government agencies, 15 universities and 25 corporates, which is the kind of cross-layer position the map suggests is needed, whoever occupies it.
What would strengthen the connections
At the research to capital interface, the most useful change is to fund commercial work inside research projects: target specifications, cost models and design partner agreements alongside the science. A companion piece on technology readiness levels sets out which commercial milestone belongs at each level.
At the capital to policy interface, clearer and simpler routes for private fund managers to use public capital would help. The RDI scheme's second-level fund manager structure is the obvious test: if it brings managers who can underwrite long technical risk, it could close much of the gap.
At the policy to demand interface, missions can treat procurement as a funding instrument. A committed order for qualified products, announced in advance, can do more to mobilise private capital than an equivalent grant, because it removes market risk. Innovation procurement routes that allow buyers to purchase development work, not only finished products, are the natural mechanism.
At the demand to research interface, corporates can move some of the money they now spend on acquisitions earlier, into paid pilots and co- development with ventures and laboratories. This gives them first sight of technology they may later want to buy, and gives researchers a real problem to solve.
Conclusion
The deeptech ecosystem in India in 2026 has strong parts: rising patent output, record private investment, well-funded missions in AI, quantum, semiconductors and space, and a new recognition category for deep tech startups. Its weakness lies in the connections. Research output outpaces early capital; capital is concentrated at seed and in AI; missions build supply faster than they create buyers; and buyers arrive late, through acquisition rather than early purchase. The layer map suggests that the most valuable interventions in the next few years will be at the interfaces, and especially at the point where policy turns into demand.
Methodology and sources
The four-layer model and the layer map, including the gap descriptions, are original to PanScience Research; holdings are observed figures from the sources below, and the gap readings are analytical interpretations. National Quantum Mission details come from the Prime Minister's Office release of 19 April 2023 (pmindia.gov.in/en/news_updates/cabinet-approves-national-quantum-mission-to-scale-up-scientific- industrial-rd-for-quantum-technologies). India Semiconductor Mission figures come from the PIB document "India Semiconductor Mission 2.0" of 7 February 2026 (static.pib.gov.in/WriteReadData/specificdocs/documents/2026/feb/doc202627782201.pdf). The space venture fund and space economy figures come from the Prime Minister's Office release of 24 October 2024 (pmindia.gov.in/en/news_updates/union- cabinet-approves-establishment-of-rs-1000-crore-venture-capital-fund-for-space-sector-under-aegis-of-in-space), and space startup and authorisation counts from YourStory's report of 22 July 2026 on remarks by an IN-SPACe director (yourstory.com/2026/07/space-startup- ecosystem-450-plus-ventures-policy-reforms-fuelled-growth-space-dir). GeM figures come from the PIB document of 28 February 2025 (static.pib.gov.in/WriteReadData/specificdocs/documents/2025/mar/doc202532511101.pdf). The RDI scheme details are from the Prime Minister's Office release of 1 July 2025 and ANRF cost from its release of 28 June 2023 (pmindia.gov.in). IVCA figures are from YourStory (17 August 2026) and CXOToday coverage; Nasscom-Zinnov figures from Zinnov's release of 25 February 2026 (zinnov.com). IndiaAI Mission figures are from a PIB backgrounder of February 2026; GERD from DST R&D Statistics 2025-26 via Parliament replies; patent figures from WIPO (PR/2025/943) and the CGPDTM Annual Report 2024-25 via S.S. Rana; Fund of Funds figures from a PMO note of 14 February 2026; PLI investment from a Lok Sabha reply of 21 July 2026 reported by Morung Express. PanScience ecosystem counts are company-reported (panscience.xyz).